What is GTMetrix? How to Use It!
GTMetrix is a free tool to analyze your website speed.
Website owners must consider website speed to ensure it doesn’t disrupt visitors’ comfort.
To check website speed, you can choose from several tools to check website speed, one of which is GTmetrix.
Furthermore, speed can also affect the technical SEO of a website.
Come on, see this article to find out how to use GTMetrix for websites!
What is GTMetrix?
GTMetrix is one of the most well-known and widely used tools for checking website speed besides Pingdom and Pagespeed Insight.
With this one tool, you can find out what the website speed score is based on several matrices. The higher the score means the better the speed of your website.
Not only shows the speed score, but GTMetrix also shows what aspects are causing your website to slow down.
GTMetrix will also give you recommendations on what to do to increase website speed.
You can use the basic version of GTMetrix for free and for a fee. In this article, we will discuss the free version of GTMetrix.
You can also watch the video below to find out about GTMetrix audio and visuals.
Also Read: All you need to know about Off-Page SEO: Link Building Guide
How GTMetrix Works
It’s easy, GTMetrix works by analyzing the speed of the website that you enter the URL.
With GTMetrix, you can choose where to check website speed. The choice of location is very important because website speed varies depending on where you are checking it from.
Some of the available locations are:
- Dallas, USA
- Hong Kong
- London, UK
- Mumbai, India
- Sydney, Australia
- Sao Paulo, Brazil
- Vancouver, Canada
You can use all browsers to use this tool. To use the mobile version, you must subscribe to the GTMetrix premium plan.
GTMetrix also allows you to change internet speed settings so you can simulate different types of connections to see how they affect your website’s loading time.
How to Analyze Website/URL in GTmetrix
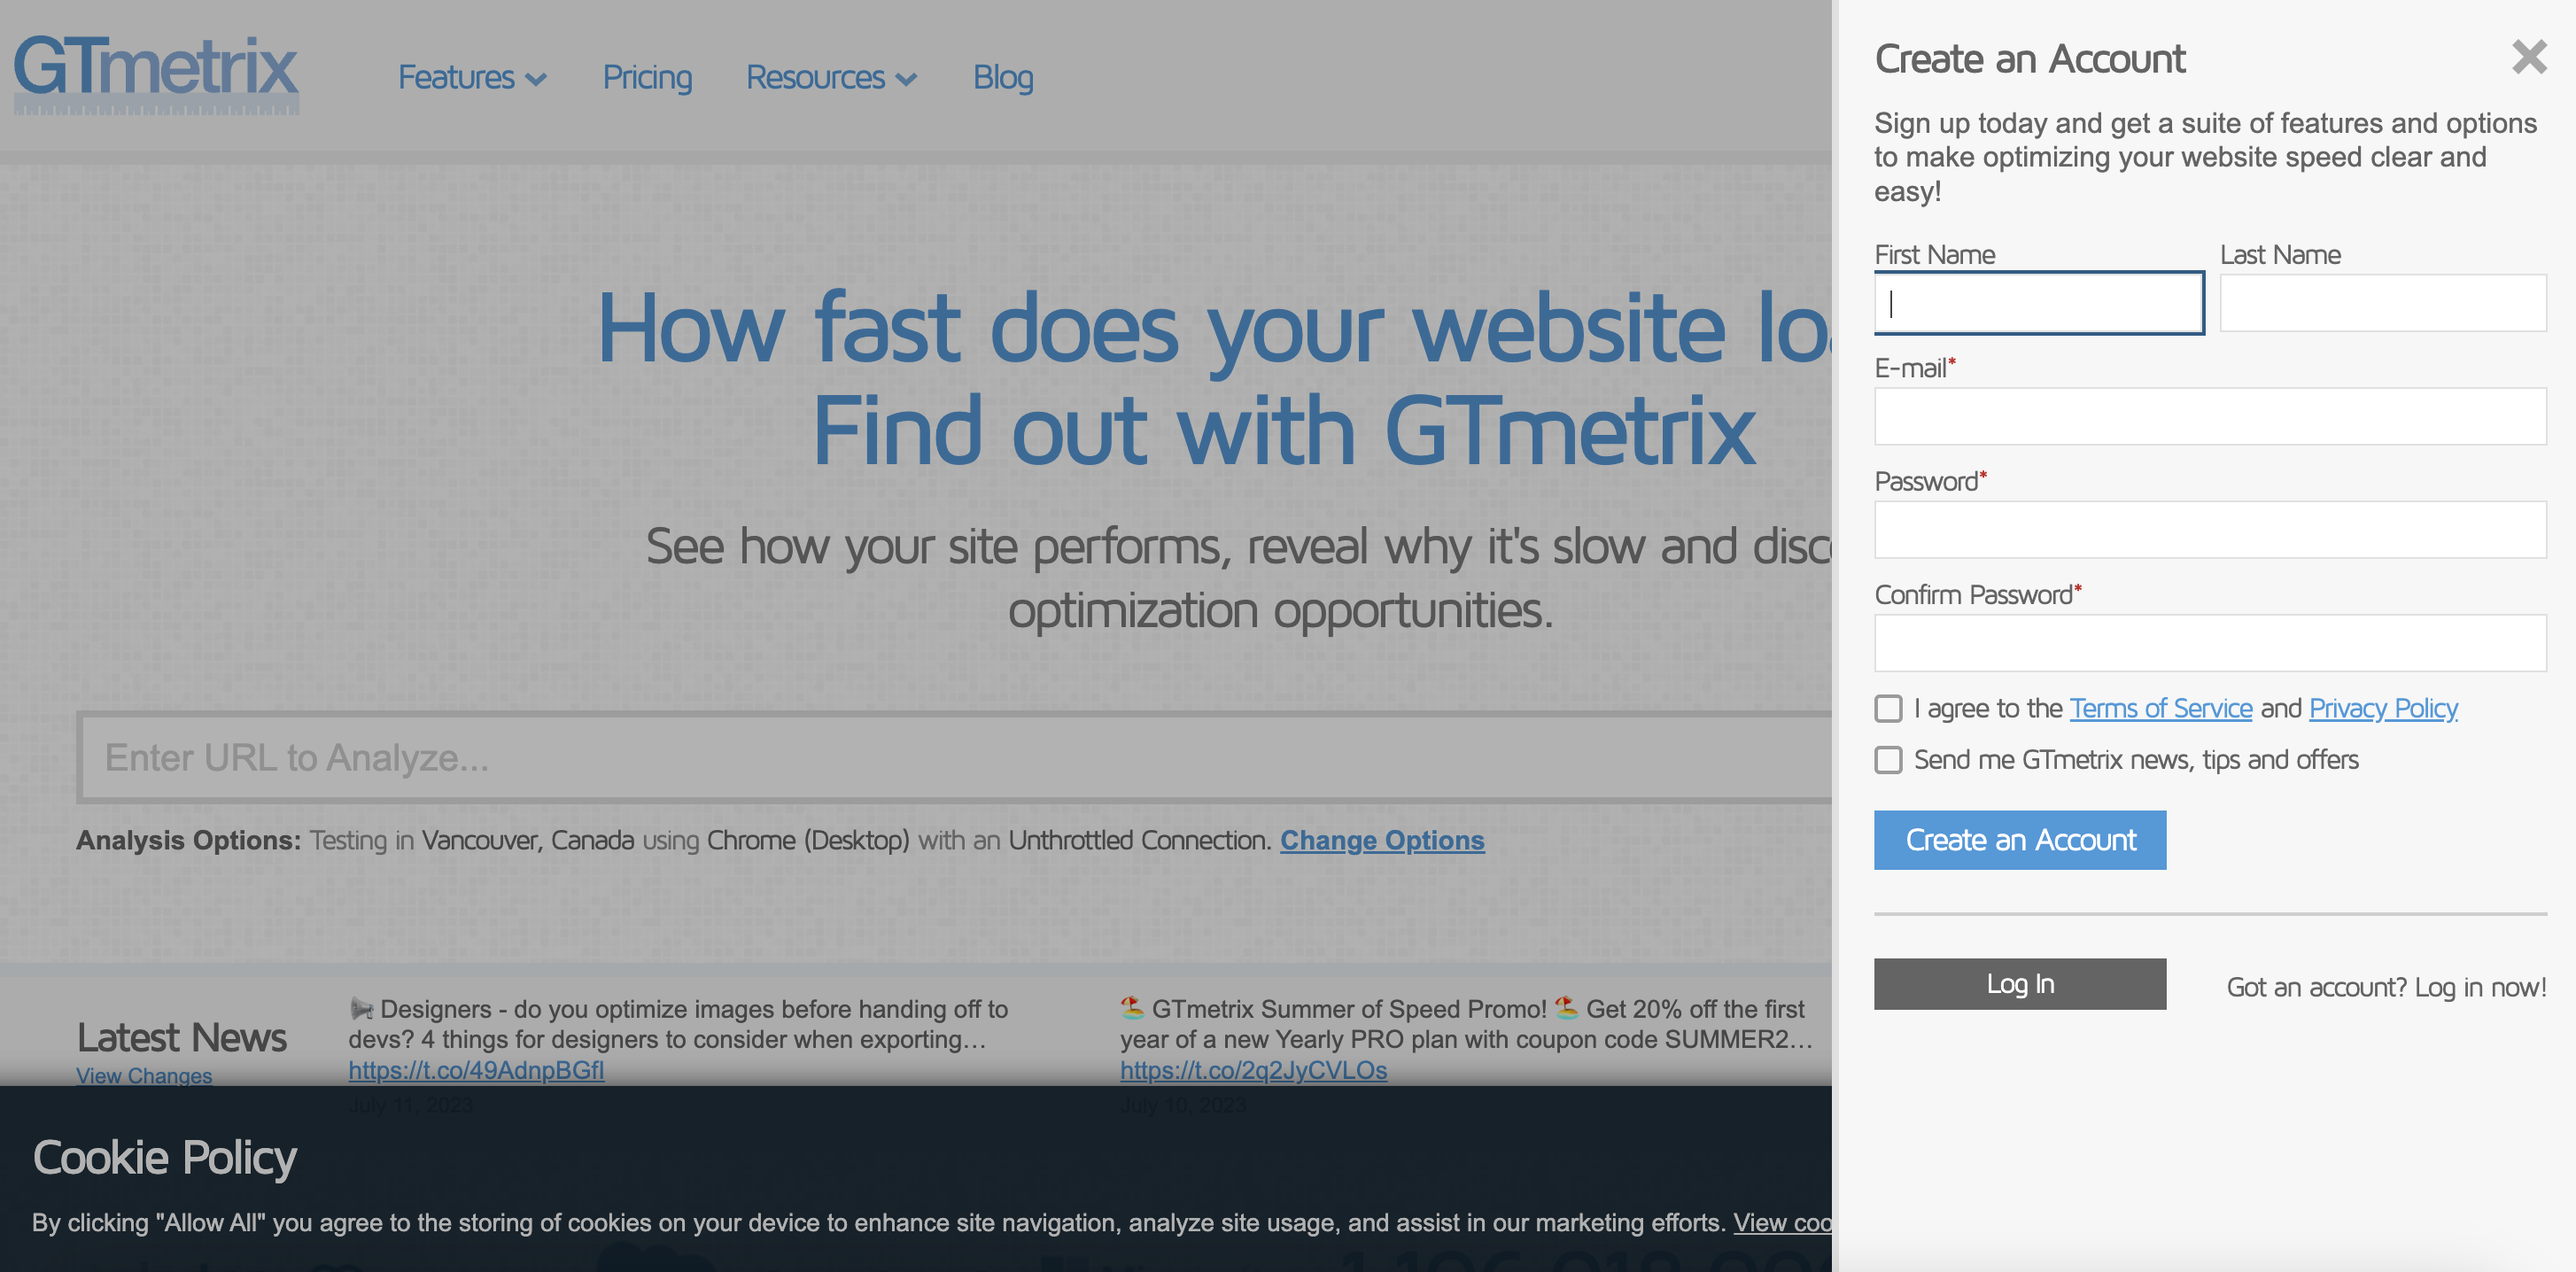
Step #1: Create a GTMetrix account for Free
Firstly, please visit the GTMetrix website. You can use GTMetrix without an account, but it is recommended to sign up for an account to get some extra features.
Step #2: Enter the website URL you want to check the speed
Next, enter the URL of the website you want to check the speed of, in my case, I have entered techbriefers.com. Then click Analyze to start the process of analysis of your website.
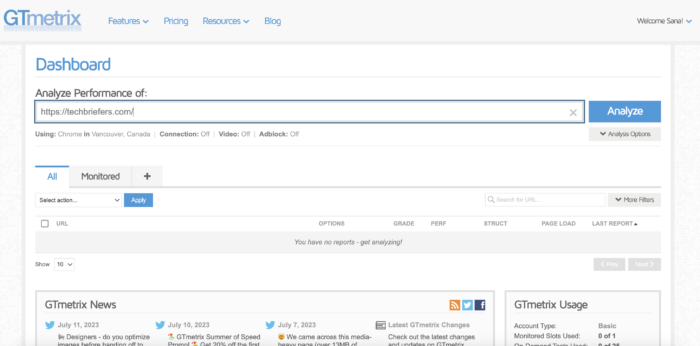
After that, you will get a performance report, including PageSpeed Score, Yslow Score, Fully Loaded Time, Total Page Size, and the number of requests your website gets.
Next, we will discuss them one by one:
How to Use GTMetrix
1. Page Speed
GTMetrix is a tool that uses the same rules as Google PageSpeed Insights in scoring your site. The rating you can get is between 0 to 100 (F to A). You will also get more than 25 recommendations.
Let’s delve into some commonly received recommendations that website owners often come across.
Serve Scaled Images
If you upload an image to the website, try to upload the image at the right size which CSS can’t change it. If you let the CSS resize it, you will get a serve scaled image recommendation.
For WordPress users, by default, WordPress sometimes resizes your images when you upload images to the media library. You can change the settings in Settings > Media.
That way CSS won’t try to resize your images to fit the width of your site. You can also automatically resize it with an image optimization plugin.
Inline Small CSS
CSS inlining is usually not recommended as it will increase the overall download size of your page request. However, if your site is small with minimal requests, this step can improve your site’s performance. To do inlining easily, you can use a free plugin like Autoptimize.
Also Read: Web Development: Front-end & Back-end Basics
Inline Small JavaScript
Similarly with inlining small CSS, and the same is true for inlining small JavaScript. Usually, it is also not recommended that you do this as it will increase the overall download size of your page request.
However, this step can also improve the performance of your website if your site is small. You can also do it using the Autoptimize plugin.
Also Read: How To Refresh/Reload A Page In JavaScript 10 Methods
Leverage Browser Caching
Leverage browser caching is one recommendation that many people often get. This usually happens because there are HTTP cache header errors on your web server.
You can only fix this if you have control over the resources on your website. For example, if you see this issue on a third-party ad network, you can’t do anything about it.
Serve Resources From a Consistent URL
If you see serve resources from a consistent URL in the GTMetrix report, you most likely have multiple resources deployed from the same URL. Usually, this can happen when there is a query string involved. Once this problem is gone, they should no longer load twice.
Defer Parsing of JavaScript
JavaScript and CSS are the default creating blocks. This means they can prevent web pages from being displayed until they are downloaded and processed by the browser. The defer attribute tells the browser to delay downloading the resource until HTML parsing is complete. Some ways to fix this problem are to use the Autoptimize or Async JavaScript plugins.
Minify CSS and JavaScript and Minify HTML
Minification is the process of removing all unnecessary characters in a source code without affecting its usability. The characters in question are line breaks, empty spaces, indents, and so on.
Minification can help reduce the size of data and speed up the process of downloading, parsing, and executing. To minify CSS, JavaScript, and HTML you can use a plugin like WP Fastest Cache.
Optimize Images
According to the HTTP Archive, as of April 2017, images account for 66% of the total loading time of a web page. So, if you intend to optimize your WordPress site, image size is the first thing you should pay attention to.
Ideally, every image should be compressed and optimized before uploading to WordPress. But unfortunately, sometimes people forget to do this. One way to help you is by installing an image optimization plugin.
This plugin will help you to compress images automatically, resize them if needed, and ensure that they are not too big.
Also Read: What Is LiteSpeed Web Server and its Advantages
Gzip is a file format and an application used for compression and decompression of a file. GZIP compression is enabled on the server side and allows further size reduction for HTML, stylesheets, and JavaScript files.
GZIP will not work for images because they are already compressed in a different way. Some people have seen a 70% reduction in data size after compression. This is probably one of the easiest optimizations you can do if you use WordPress.
Minimize Redirects
Minimizing HTTP redirects from one URL to another reduces additional RTT and waiting time for users. For those of you who use WordPress redirects, they slow down the loading time of your website. Therefore, it’s a good idea to take the time to minimize the number of redirect visitors.
Specify a Cache Validator
The specified cache validator recommendation will appear if there are missing HTTP caching headers. This must be included in every origin server response, as it both validates and caches length.
If the header is not found, it will generate a new request for the resource every time, which increases the load on your server.
Utilizing header caching ensures that subsequent requests don’t need to be loaded from the server, thereby saving bandwidth and improving the performance of your website.
It’s also worth remembering that you can’t fix it if the problem arises from a third-party resource.
Specify Image Dimensions
You should provide details on the dimensions of the image you are uploading specifically. This means including the width and height of your image in the HTML code.
Incorrect example:
<img src=”https://domain.com/images/image1.png”>
True example:
<img src=”https://domain.com/images/image1.png” width=”200″ height=”100″>
Remove Query Strings from Static Resources
Your JavaScript and CSS files will usually have the file version at the end of their URL, for example, exampledomain.com/style.css?ver=4.6.
Some servers and proxy servers are usually unable to cache query strings, even if the cache-control: public header is present.
So by deleting them, you can sometimes improve caching on your website. This can easily be done with code or a free WordPress plugin.
Specify a Vary: Accept-Encoding Header
This is an HTTP header and must be included in any origin server response, as it tells the browser whether or not the client can handle the compressed version of the content. Usually, when GZIP compression is enabled, this is also fixed.
2. YSlow
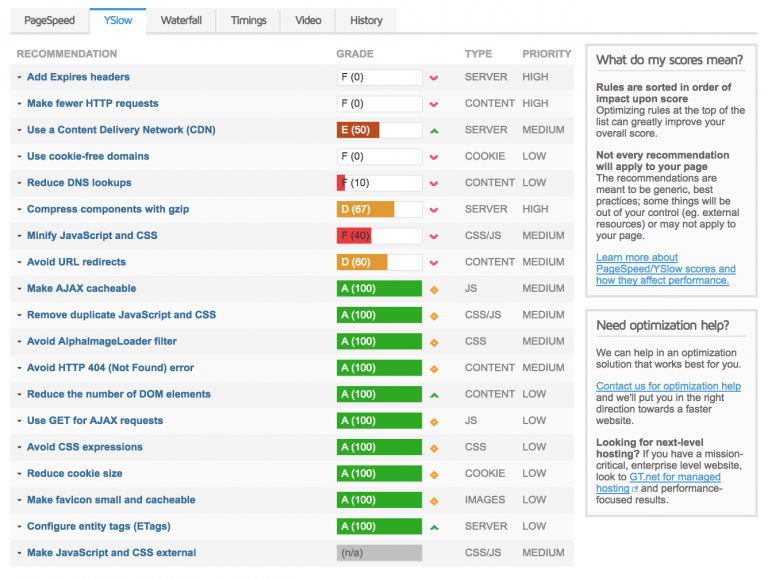
GTMetrix also uses YSlow to give your website value. In this section, there are more than 15 recommendations that you might get. Same with the recommendations in Page Speed, if you follow these recommendations, you will see an increase in the loading time of your website.
Make Fewer HTTP Requests
As you probably already know, everything loaded on your website like plugins, images, and fonts makes HTTP requests.
This is one of the reasons why it is not recommended that you install 100 plugins at the same time because they will likely perform CSS script and JavaScript requests which of course will collect hundreds of HTTP requests.
Add Expires Headers
HTTP Caching: The Cache-Control header is defined as part of the HTTP/1.1 specification and replaces the header previously used to define response caching policies.
All modern browsers support Cache-Control, so that’s all you need. However, there is nothing wrong if you have both, but remember that only one will be used.
The Expires Header uses the actual date, while the Cache-Control header allows you to specify the amount of time before it expires.
Use a Content Delivery Network (CDN)
CDN stores cached copies of content in POPs that are located closer to the visitor, thereby speeding up loading times by reducing latency. Cloudflare is one of the highly recommended CDN providers that you can easily use with your WordPress site.
Use Cookie-Free Domains
In general, when you are serving content such as images, JavaScript and CSS, there is no reason for an HTTP cookie to go along with it because it will add overhead. Once a server sets a cookie for a given domain, all subsequent HTTP requests for that domain must include a cookie.
This warning is usually seen on sites with a large number of requests. Some ways to fix this include using a CDN provider that deletes cookies or creating separate domains and subdomains to serve cookies.
Also Read: How to work with Session and Cookies in CodeIgniter
Reduce DNS Lookups
Every domain you search returns the first DNS lookup until cached. So for example, let’s say you load 10 assets from a CDN, 2 from Google web fonts, and 5 from a third-party advertiser. This will result in 3 DNS lookups because each of those clusters performs queries within one domain.
DNS lookups can quickly get out of hand when you start adding external services. One example of a way to mitigate this is to host Google fonts on your own CDN, which will get rid of DNS lookups to Google.
Make Favicon Small and Cacheable
A favicon, or favicon.ico, is a small image icon file that’s associated with your website and appears in your browser’s address bar (or when you set it as a bookmark ). Even if the favicon is very small, you should always optimize it.
Configure Entity Tags (ETags)
The ETag header is very similar to the last modified header. It is also used to validate cache files. If you are running Apache 2.4 or later, the ETag header is added automatically using the FileETag directive. And if you are using NGINX, since 2016 the ETag header is enabled by default.
If you see this warning, we recommend contacting your hosting provider to check your cloud hosting.
3. GTMetrix Waterfall Chart
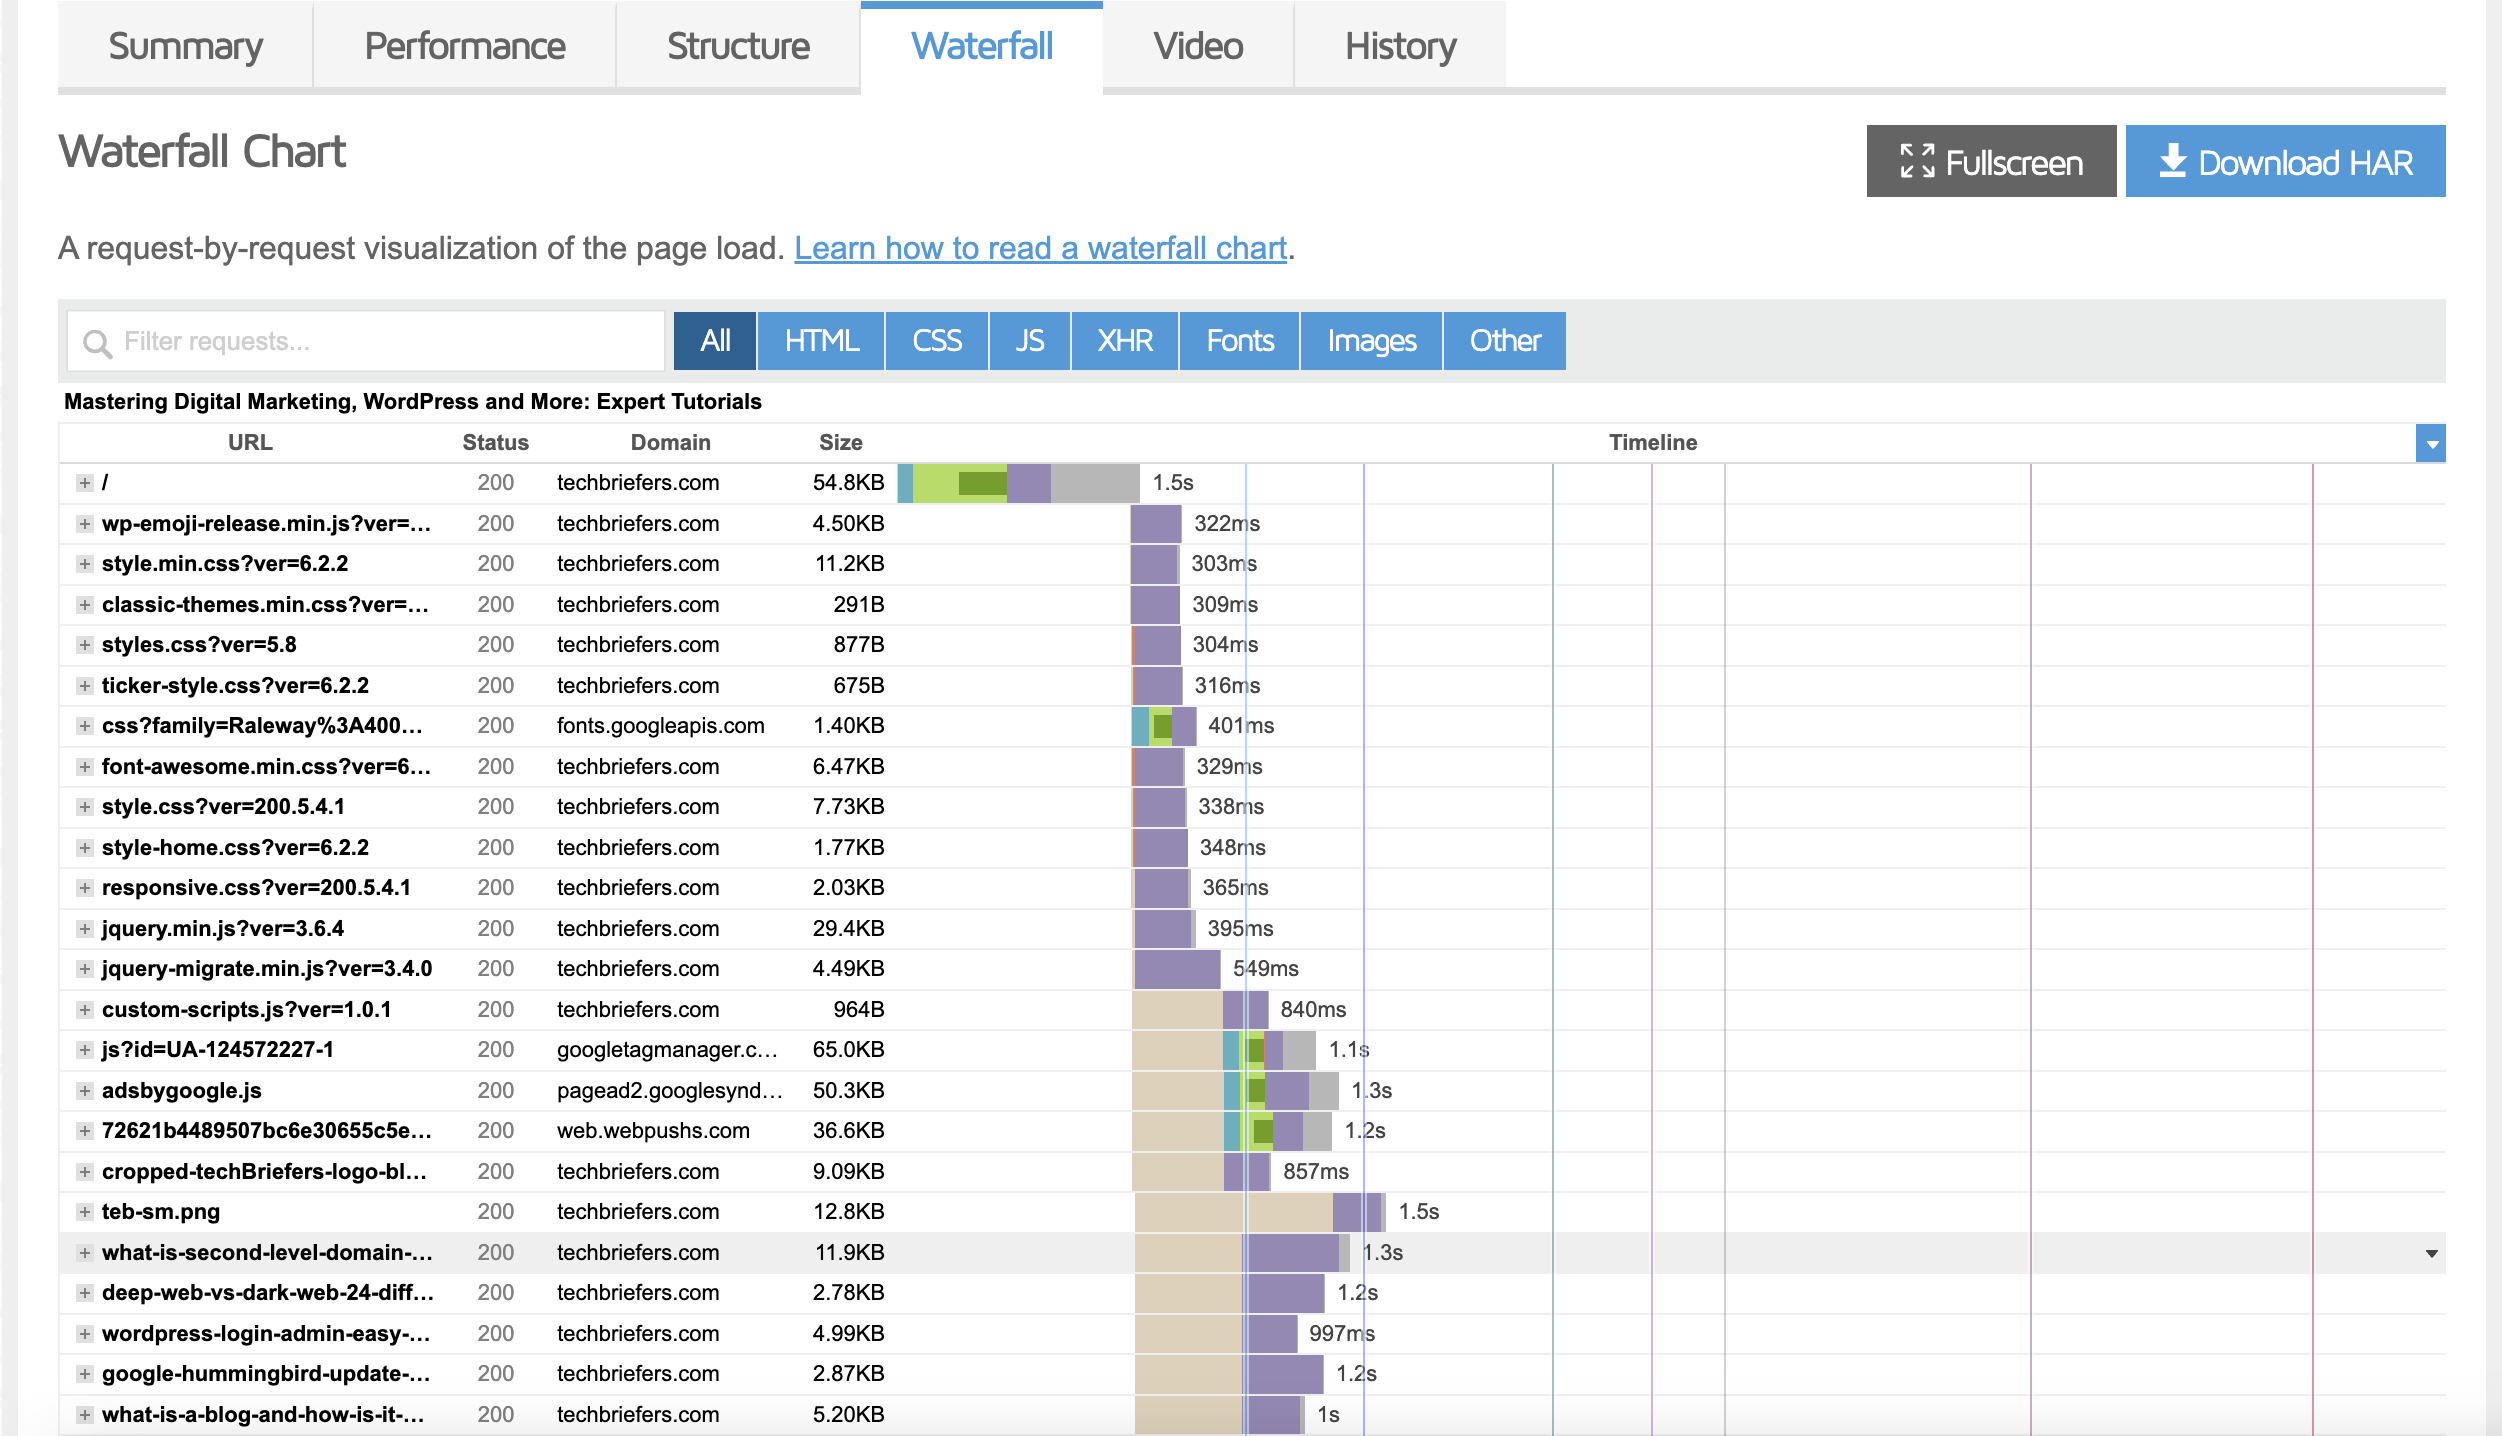
The GTMetrix Waterfall Chart is an assessment result that displays all requests on your page. You can analyze each request to see what is causing the slowness and performance issues on your website.
This chart will appear in the form of line colors. Below is an explanation for each line color that appears in the report.
Blocking (Brown)
When a browser loads a website, JavaScript and CSS resources will block the web page from being rendered until they have actually finished being loaded and processed by the browser. This waiting time is called blocking by GTMetrix Waterfall Chart.
DNS Lookup (Teal)
DNS Lookup is a collection of servers called Domain Name Servers that store all the information about your website and the IP addresses where your website traffic will be directed.
When you first enter a website URL for GTMetrix to analyze, they will perform a new lookup. Since they need to query the DNS to get the IP address information, this requires a longer lookup time.
Connected (Green)
Connecting in GTMetrix is the time it takes to establish a TCP connection. In essence, this is a method of communication between the host or client and the server that must be running.
Sending (Red)
Sending time is the time it takes to send data from the browser to the server.
Waiting (Fog)
The waiting time in GTMetrix is the time for the first byte, also known as TTFB in some tools. TTFB is a measurement used to indicate the responsiveness of a web server or other network resource.
Generally, anything under 100 ms is a pretty good TTFB. If your website’s waiting time is at 300-400 ms, there may be a configuration error on your server or it may be time to upgrade.
Receiving (Grey)
Receiving time is the time it takes your browser to receive data from the server.
Event Timings
Every time you load a web page, the server takes some time to serve the page.
- First Paint (Green Line): The first point at which the browser renders the page, such as displaying the background color.
- DOM Loaded (Blue Line): The point where the DOM ( Document Object Model ) is ready.
- Onload (Red Line): When page processing is complete and all resources on the page (images, CSS, etc.) have finished loading.
- Fully Loaded (Purple Line): The point after the onload event fires and there is no network activity for 2 seconds.
HTTP Response Headers
You can also click individual requests for HTTP response headers.
In this option you can see things like GZIP enabled on a web server, web running on HHVM, web served from cache, cache-control headers, server architecture (this is not always visible), expires headers, browser user-agent, and much more.
4. History
The history tab in GTMetrix is a collection list of all the speed tests that have ever been performed. For free accounts, there is a limit to the number of stored URLs. You can also save URLs that you want to monitor to see changes in web performance.
Let’s Check Your Website Speed!
GTMetrix is a free tool that can be used to check website speed so that owners can improvise.
Website speed is indeed an important thing that must be considered by website owners because it can affect visitor comfort as well as have an impact on technical SEO.
Besides GTMetrix, there are also tools like Pingdom and Google Pagespeed Insight to check website speed. But keep in mind, use only one tool to ensure consistency of test results and take the right steps.
Hope this article will be helpful.

Leave a Reply